
01
Where is the load building?
Station, track, train and time.
APTA 2026Meet us at TRANSform & EXPO · Chicago · October 4–7
Tagus Orbit APC · Automatic Passenger Counting
Stationary and onboard APC in one software layer. Real-time counts, occupancy, sensor health, alerts and data quality for transit agencies and technology partners.
The challenge
Passenger demand changes by the hour. The numbers alone don’t say whether a quiet reading means quiet service or a disconnected sensor.
Station, track, train and time.
Connection, fault and tamper states.
Quality signals before anything is reported.
Counts say how many. Operations also need to know whether to trust them.
The platform
Platform-mounted sensors with station and track context.
Bus and train door sensors with vehicle and trip context.
Train In and Train Out by station, track and train, with point-level inspection.
Boarding and alighting alongside train load and vehicle-event context.
Every sensor’s state and timestamp. The one that needs attention stands out.
Detect, notify, investigate, verify recovery. Rules agreed per deployment.
Transmission patterns, quality diagnostics and control charts before reporting.
A REST API to agency systems and technology partners.
Case in point
Counts, sensor condition and data quality side by side, the way operators and analysts use them.
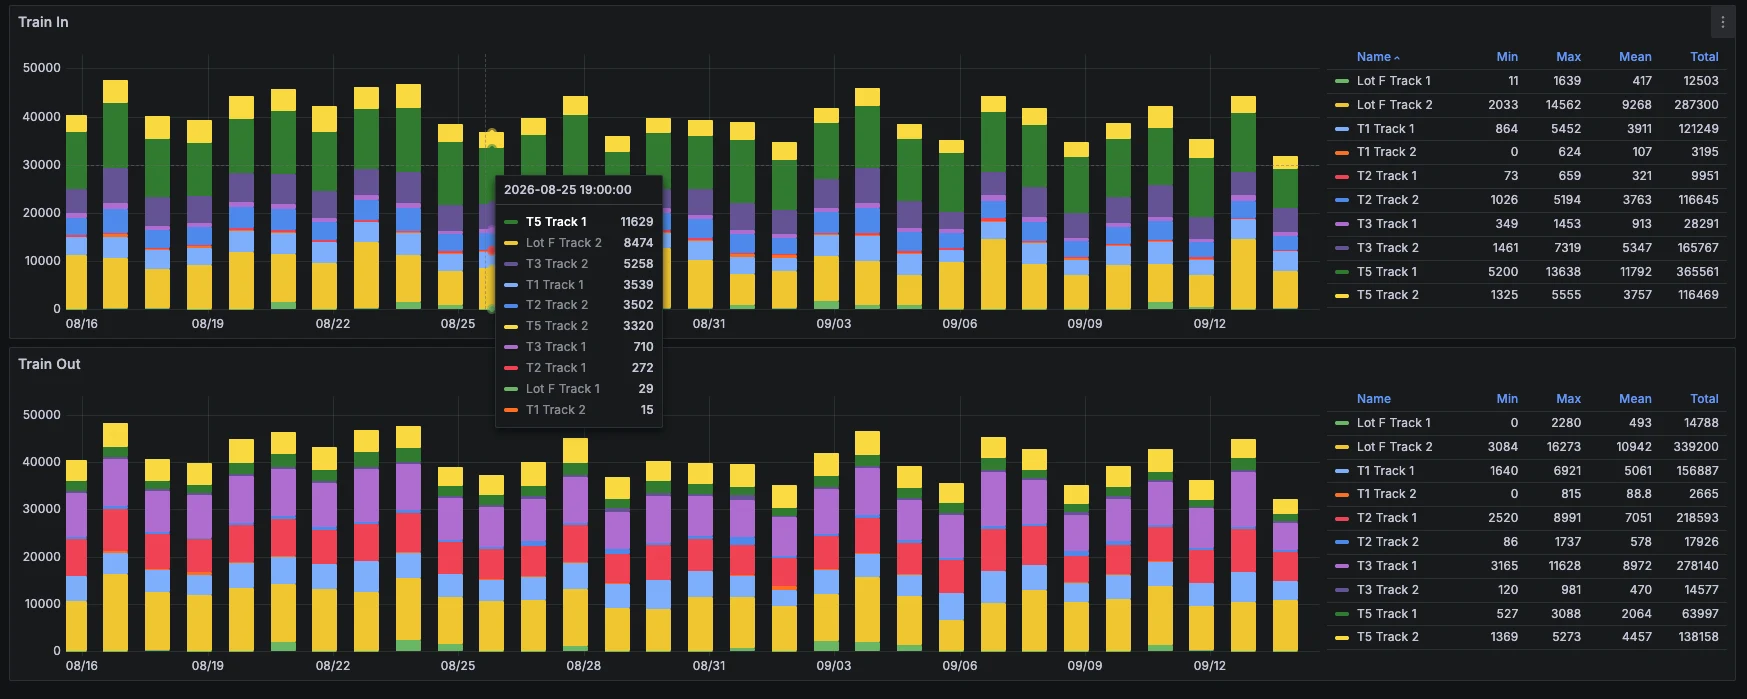
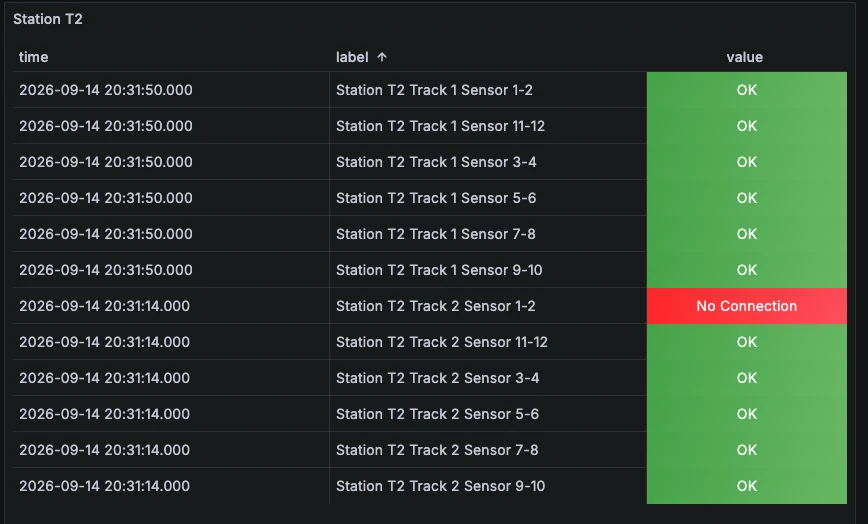
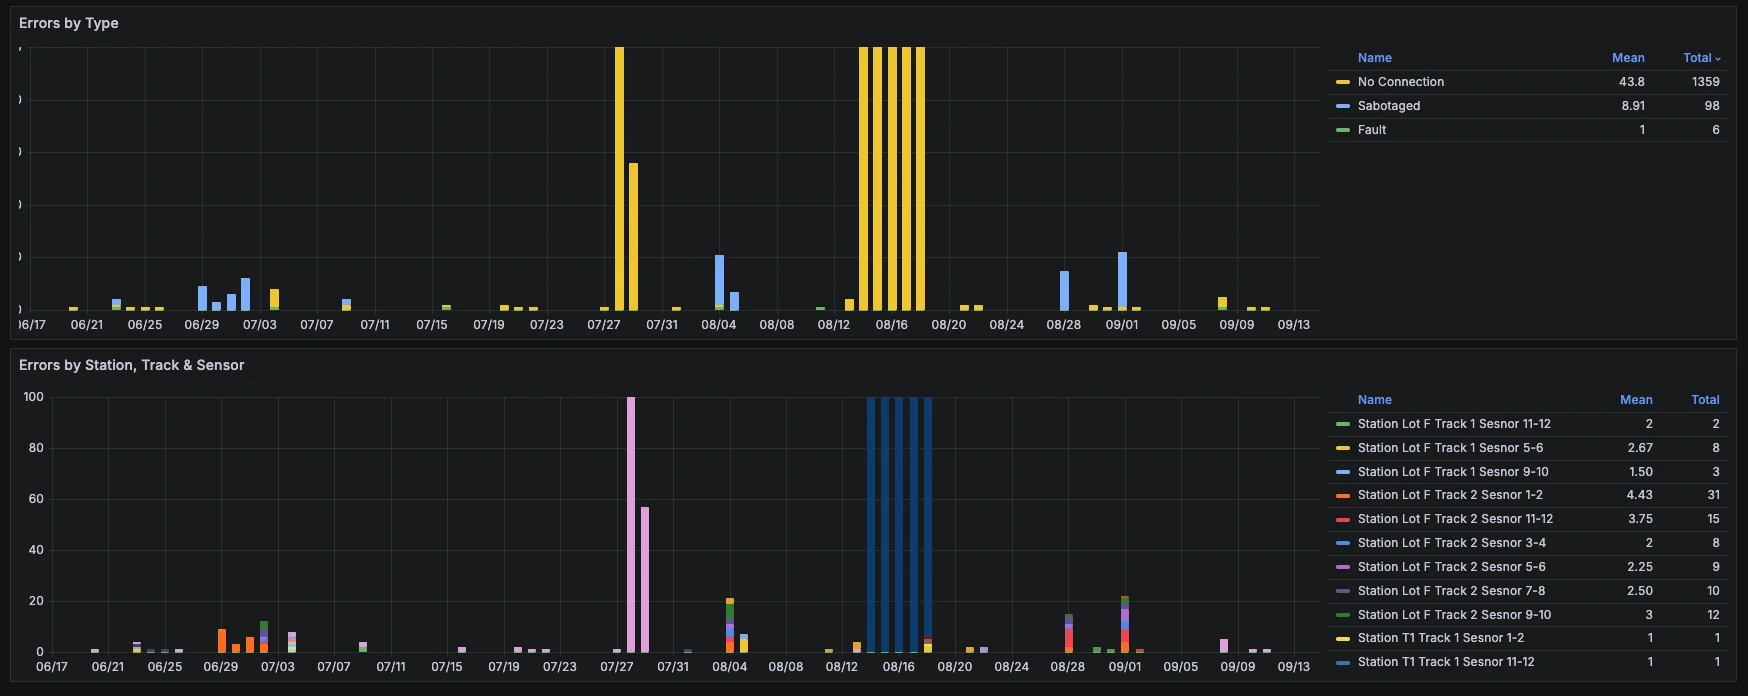
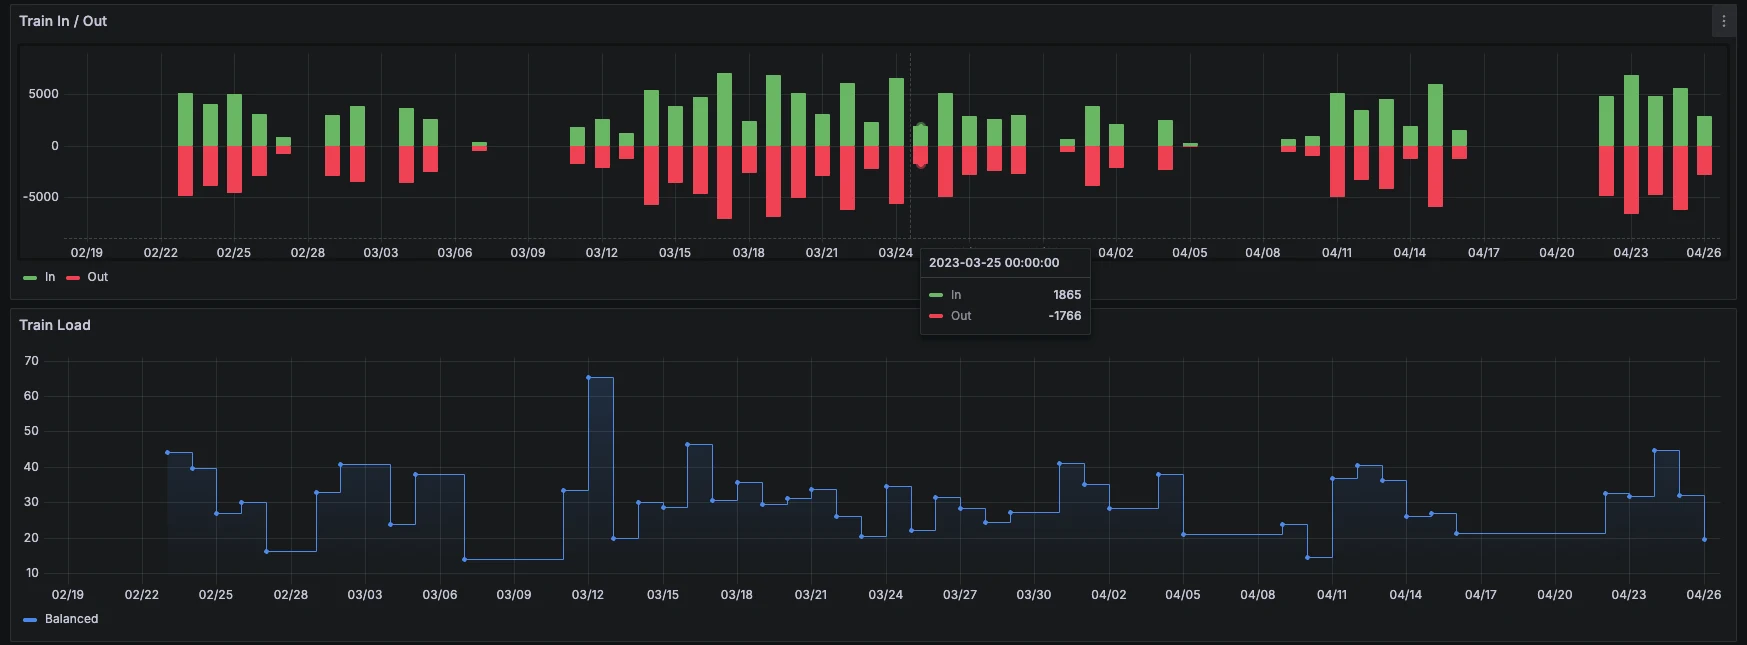
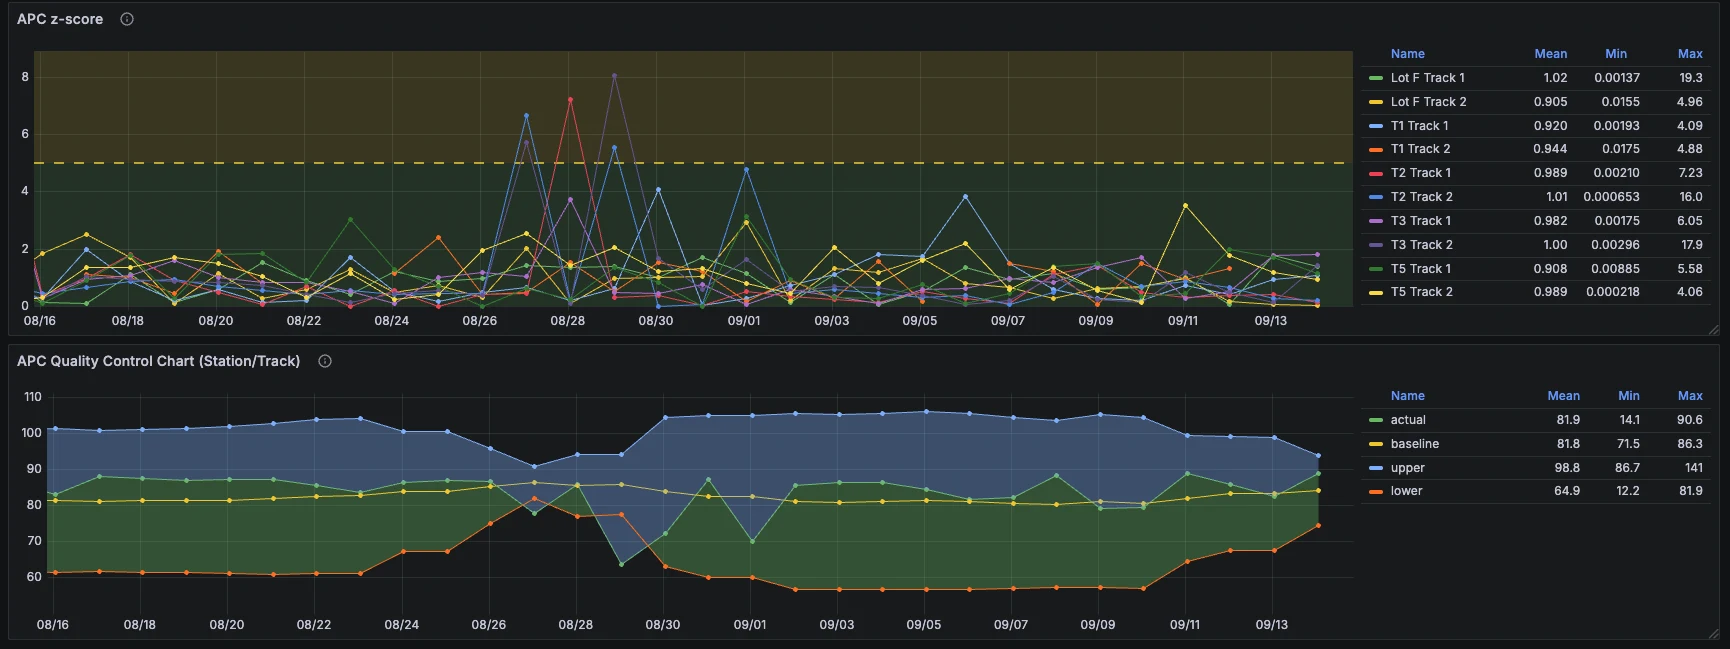
Captured views from the Chicago solution dashboards, not a live feed. Metric definitions are confirmed during technical scoping.
Architecture
Stationary and onboard APC
Counts, occupancy and quality context
Dashboards, alerts and stored events
Agency systems and technology partners
A hosted environment with an agreed access and operations model.
An agency-controlled environment with an agreed infrastructure and support model.
Conceptual architecture. Containerized services; protocols, schemas, authentication and latency are confirmed during integration design.
Next step
One operating area. Agreed acceptance criteria. Evidence you can review with operations and IT.
Choose a station, corridor or vehicle group, and the sensors and integrations in play.
Counts, data delivery and fault handling against a baseline agreed up front.
Walk through the results together with operations and IT, then decide what’s next.
Request a Chicago solution walkthrough or a partner integration session.
contact@tagusorbit.com